 |
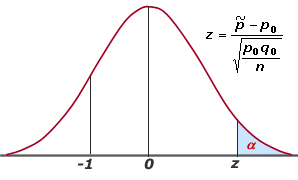
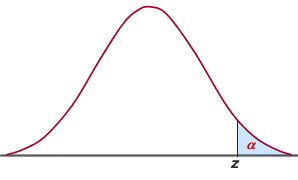 Table to calculate the area under the Standard Normal Probability Curve. |
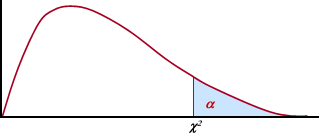
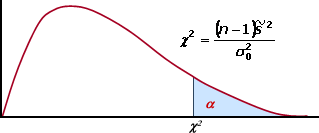
Table to calculate the critical value for a chi-square distribution
with df degrees
of freedom and for an |
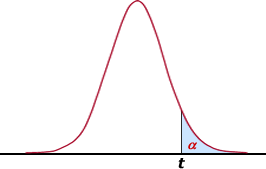
Table to calculate the critical value for a Student’s
t-distribution with df degrees
of freedom and for an |
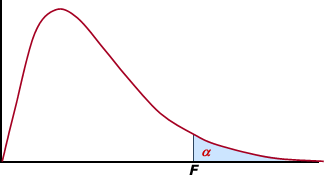
Table to calculate the critical value for a Snedecor’s F-distribution with df1 and df2 degrees of freedom and for a 0.05 significant level. |

Spreadsheet to calculate critical values for standard normal, normal, chi-squared, t- and F distributions. |
EDUCATIONAL TOOLS FOR LEARNING STATISTICS IN BIOINFORMATICS
Statistical tables (pdf format) and spreadsheet (MS-excel format) to calculate critical values of the more important statistical distributions
Standard normal distribution N(0,1)
Chi-square distribution
Student's t-distribution
Snedecor's F -distribution
MS-excel spreadsheets of normal, chi-squared, t- and F- distributions
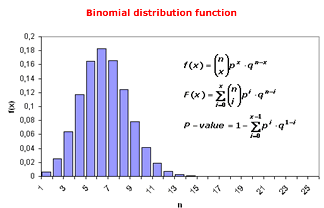
Considering n Bernoulli independent variables X1,X2,…,Xn with a probability of success p1=p2=…=pn, the X random variable is defined as equal to the number of successes in the n trials and follows a binomial distribution. |
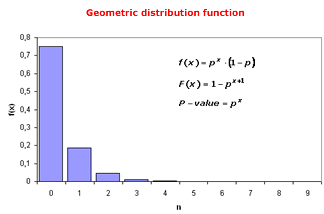
Considering n Bernoulli independent variables X1,X2,…,Xn with a probability of success p1=p2=…=pn, the probability that the success on the mth trials follows a geometric distribution. |
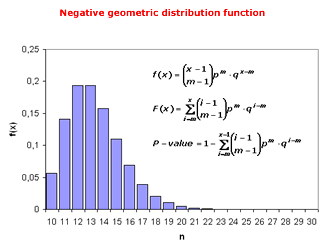
Considering n Bernoulli independent variables X1,X2,…,Xn with a probability of success p1=p2=…=pn, the X random variable is defined as equal to the number of successes until the mth unsuccessful is observed and follows a negative geometric distribution. |
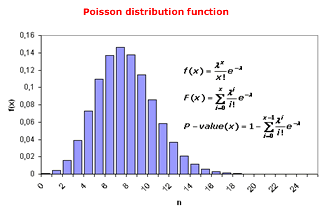
A binomial distribution, with n large
and p small, can be approximated by
a Poission distribution with parameter |
 (the approach can be made when n>50
and p<0.1).
(the approach can be made when n>50
and p<0.1). 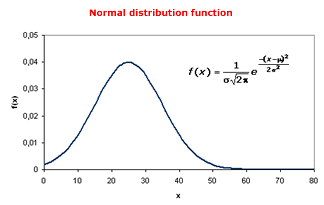
Normal distribution with a mean |
 and standard deviation s.
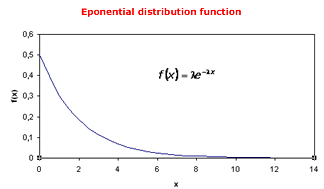
Exponential distribution with parameter 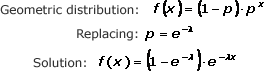
|
MS-Excel Spreadsheets for the graphical study of distribution functions
Binomial distribution
Geometric distribution
Negative geometric distribution
Poisson distribution
Normal distribution
Exponential distribution
MS-Excel spreadsheets for one-sample hypothesis tests
Conformity of the mean (normal distribution) with  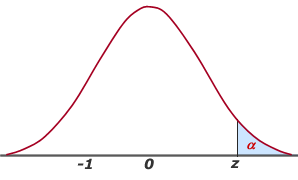
Conformity of the mean (normal distribution) with 
Conformity of the mean (normal distribution) with  |
Conformity of the sample proportion with the population proportion. |
Conformity of the sample variance with the population variance. |
One-sample hypothesis test for mean
One-sample hypothesis test for proportion
One-sample hypothesis test for variance
MS-Excel spreadsheet for the estimation of confidence intervals
Confidence intervals for the mean (normal distribution) with
Confidence intervals for the mean (normal distribution) with
 |
Confidence interval for proportion.
|

Confidence intervals for variance. 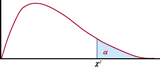
Confidence intervals for variance ratios. ????  |
Confidence intervals for mean
Confidence interval for proportion
Confidence intervals for variances
Spreadsheets of MS-Excel two-sample hypothesis tests
Hypothesis test of two means that follow a normal distribution
and with the two Hypothesis test of two means that follow a normal distribution
and with the two 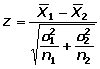
Hypothesis test of two means that follow a normal distribution
and with the two 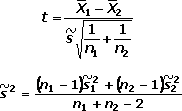 Hypothesis test of two means that follow a normal distribution
and with the two 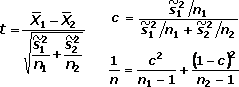
|
Hypothesis test of two means from dependent samples that follow
a normal distribution and with known 
Hypothesis test of two means from dependent samples that follow
a normal distribution, with 
Hypothesis test of two means from dependent samples that follow
a normal distribution, with  |
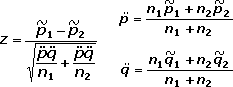
Hypothesis test for proportions with p1 and p2 known. 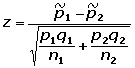
|
Test for variance.
|
Two sample hypothesis test for two independent means
Two sample hypothesis test for two dependent means
Two samples hypothesis test for two proportions
Two sample hypothesis test for two variances
Spreadsheets for Bioinformatics statistical tests
Global Binomial test: the test is based on to count the number of correct alignments between the two sequences. This variable follows a binomial distribution that can be approached with a normal distribution if the sequences are very large. 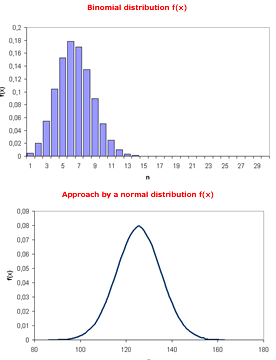 |
|
Likelihood ratio: in many cases the null and alternative hypothesis can be compared using a logarithm of the likelihood ratio. This variable follows a binomial distribution that can be approached with a normal distribution if the sequences are very large. |
A local success run test: this test is applied to compare two sequences and is based on the length of the local success. The statistic is defined as the maximum length of the well aligned base fragments and follows a distribution of the maximum of n geometric distributions. 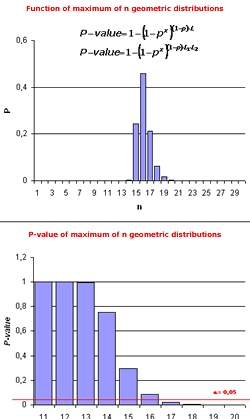 |
BLAST Basic Local Alignment Search Tool (Altschul, S.F., Gish W., Miller W., Myers E.W., and Lipman D.J. J. Mol. Biol. 1990: 215:403-10) is an algorithm used to study nucleic acid sequence alignments and the predicted maximum length of the well-aligned segment is used. 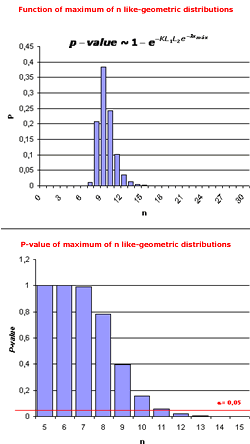 |
BLAST Basic Local Alignment Search Tool (Altschul, S.F., Gish W., Miller W., Myers E.W., and Lipman D.J. J. Mol. Biol. 1990: 215:403-10) is an algorithm used to study protein sequence and the predicted maximum length of the well-aligned segment is used. 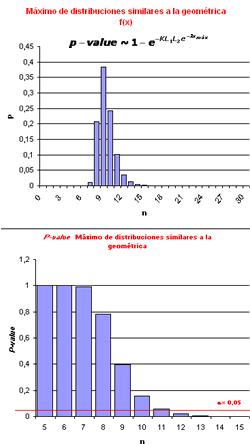 |
Global Binomial test and it's aproximation by normal distribution
Likelihood ratio - binomial distribution and it's aproximation by normal distribution
Local sucess run test
BLAST: Nucleotide sequence comparisons
BLAST: Protein sequences comparisons
 [
[